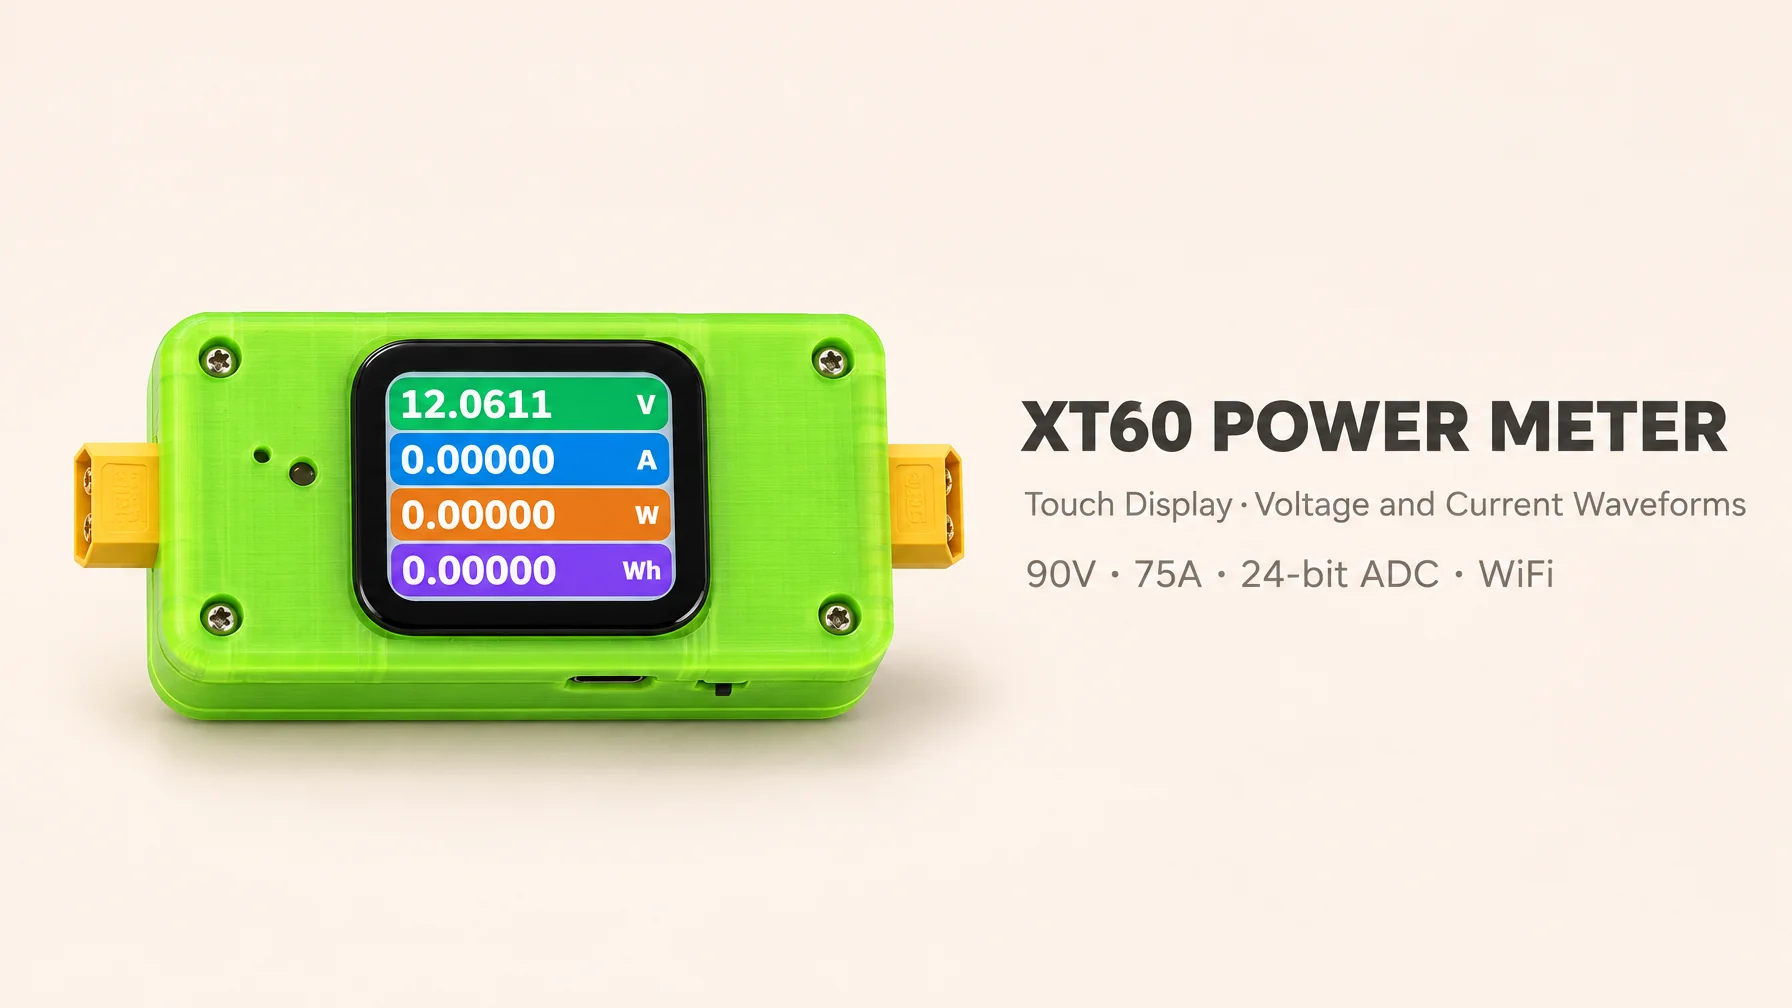
An open-source DC power meter that plugs directly into an XT60 loop: ESP32-S3 as the host, TI ADS131M02 24-bit dual-channel simultaneous-sampling ADC at 4 kSPS, a 1 mΩ four-terminal Kelvin shunt plus a 101:1 precision divider, measuring 0–90 V and ±30 A rated (±75 A peak). A 1.83-inch IPS touch color screen runs an LVGL 9 UI with an oscilloscope-style waveform page; once WiFi is connected, a browser-based web console shows live data and waveforms, edits settings and exports CSV. Hardware, firmware, enclosure and production files are all open-source.
- 🎬 Demo video: https://www.bilibili.com/video/BV1pNWU6qE3P/
- 💬 Electronics / MCU tech QQ group: 307449735
- 🌐 Community: https://bbs.eeclub.top/
- 📦 GitHub: https://github.com/zeruns/xt60-power-meter
- 📦 Gitee: https://gitee.com/zeruns/xt60-power-meter
- 🔧 OSHWHub / LCEDA open-hardware project: https://oshwhub.com/zeruns/xt60-power-meter-esp32
- 🇨🇳 Chinese version: https://blog.zeruns.com/archives/967.html

One thing to be clear about up front: the software for this project was developed by AI. I designed the hardware myself; the firmware — from architecture to implementation — was largely handed to AI, while I defined the requirements, reviewed the design and verified it on real hardware. If that bothers you, stop here. If all you care about is "does it work and how do I build one", read on — the code, documentation and test tools are all public.
Also: 75 A is the peak capability, the rated current is ±30 A, and this is a debugging tool, not a metering instrument. All download links are collected at the end of the article.
Table of Contents
- 1. Project Overview
- 2. Gallery
- 3. Hardware Design
- 4. Software Design
- 5. Enclosure & Assembly
- 6. Build & Reproduction
- 7. Usage
- 8. Roadmap
- 9. Known Issues
- 10. Repository Structure
- 11. Documentation Index
- 12. Contributing
- 13. License
- 14. Disclaimer
- Open-Source Project Recommendations
- Recommended Reading
1. Project Overview
When flying RC models, testing drones or cycling battery packs, you often need a power meter that plugs directly into the XT60 loop: you want to see the voltage sag under high current, capture the inrush waveform when connecting a load, and ideally sync the data to a PC. Commercial units either have tiny screens, no waveform view, or keep data locked on the device — so this project exists.
The XT60 Power Meter is built around an ESP32-S3 and a TI ADS131M02 24-bit dual-channel simultaneous-sampling ADC (4 kSPS), combined with a 1 mΩ four-terminal Kelvin shunt and a 101:1 precision divider. It measures DC circuits up to 0–90 V, ±30 A rated (±75 A peak). A 1.83-inch IPS color LCD runs an LVGL 9 UI with three pages (measure / waveform / settings). Once connected to WiFi, the web console lets you watch live data and waveforms, change settings and export CSV from any browser, and a complete HTTP API is available for your own host software or automation scripts.
Highlights
| Category | Features |
|---|---|
| Measurement | Average voltage / current (DC), instantaneous and average power, accumulated energy (Wh), capacity (Ah), runtime |
| Sampling | ADS131M02 24-bit dual-channel simultaneous sampling at 4 kSPS, CRC frame validation drops corrupted frames |
| Waveform | Oscilloscope-style dual-axis chart, V/I/P modes, six time windows from 1 s to 10 min, auto-ranging on 1-2-5 grid values |
| Interaction | Capacitive touch + two buttons, pull-up quick menu on the main page, three swipeable pages, IMU auto-rotation, automatic dimming |
| Alarms | Configurable over-voltage (max 90 V) / over-current (max 70 A) / over-power (max 6300 W) thresholds plus always-on over-temperature protection (dual temperature sources, ≥65 °C) |
| Connectivity | WiFi STA/AP provisioning, five-tab web console (live / waveform / settings / API / logs), 15 Hz WebSocket streaming |
| Power | XT60 input / USB / Li-ion battery, TPS2116 automatic USB-battery priority switchover, TP4057 charging |
| Engineering | Dual OTA partitions with rollback, coredump capture, PC-side LVGL UI simulator, host unit tests |
Key Specifications
| Item | Value |
|---|---|
| MCU | ESP32-S3-WROOM-1-N16R8 (16 MB Flash + 8 MB octal PSRAM, dual-core 240 MHz) |
| Metering ADC | TI ADS131M02, 24-bit Σ-Δ, dual-channel simultaneous sampling, 4 kSPS |
| Voltage range | 0–90 V design range (the divider is theoretically ±121 V, limited to 90 V by the 100 V maximum auxiliary supply input) |
| Current range | ±75 A peak (ADC full scale with 1 mΩ + PGA 16x); ±30 A rated (5 W shunt allows 70 A, XT60 connector rated 30 A) |
| Connector | XT60 (rated 30 A; builders may redesign the bottom board with XT90 to use the full 70 A shunt capability) |
| Display | 1.83-inch IPS, 240×284 (landscape 284×240), NV3030B controller, QSPI; CST816D capacitive touch |
| Sensors | SC7A20HTR 3-axis accelerometer (auto-rotate), AHT20 temperature / humidity |
| Power | XT60 input (SY8511BADC 3.3 V / 1 A), USB/battery (TLV62084 3.3 V / 2 A), TPS2116 automatic USB-battery priority switch, TP4057 400 mA charging |
| Wireless | WiFi 2.4 GHz (STA/AP), HTTP + WebSocket |
| Enclosure | SolidWorks sources + 3MF print files (top cover / middle frame / bottom cover) |
⚠️ Scope and limits. This device is intended for hobbyist measurement and debugging and is not a certified metering instrument. Currents below 2 mA are displayed as 0 (small-signal deadband); the waveform page still shows mA-level detail. When powered from the XT60 input, the minimum start-up voltage is 5 V.
2. Gallery
2.1 Appearance
| Front | Back |
|---|---|
 |
 |

The enclosure is 3D-printed in three parts (top cover, middle frame, bottom cover) and held by screws.
The front is a 1.83-inch IPS screen; on its left are the system status LED and the reset button. Two physical buttons (K1/K2) are provided on the body — swipe up on the screen or long-press K2 to open the quick menu. The switch to the right of the USB-C port selects the power source (battery & USB, or XT60).
2.2 Internal Structure
| Top board with battery | Stacked assembly |
|---|---|
 |
 |
The device uses a two-board stacked construction: the top board carries the MCU, display, sensors, buttons, voltage divider and power management; the bottom board carries the XT60 input/output and the 1 mΩ shunt. The battery sits on the back of the top board, sandwiched between the two boards; fix it with double-sided tape or foam, and preferably wrap it in insulating paper.
2.3 Screen UI
| Main measurement page | Oscilloscope-style waveform page |
|---|---|
 |
 |
| Four rows of large digits (voltage / current / power / energy); energy, temperature/humidity and peak values at the bottom | V/I/P multi-mode dual-axis curves, 1 s–10 min time windows, auto-ranging |
| Settings page | Quick menu (pull up) |
|---|---|
 |
 |
| Second-level pages for measurement settings, display & sound, WiFi, alarms and energy statistics | Clear energy statistics (with confirmation), data refresh rate 1–30 Hz |
The UI images above come from the project's PC-side LVGL simulator (
tools/ui_sim) and match real-device rendering.
2.4 Web Console
| Live data | Waveform |
|---|---|
 |
 |

Open the device IP in a phone or PC browser — no app installation required. If the network is unavailable, the local UI keeps working normally.
3. Hardware Design
3.1 System Architecture

The system consists of six parts:
| Module | Key devices | Responsibility |
|---|---|---|
| MCU | ESP32-S3-WROOM-1-N16R8 | Sampling scheduling, UI rendering, WiFi, data storage |
| Metering front end | ADS131M02 + LRA8551A | Simultaneous voltage/current sampling, 24-bit, 4 kSPS |
| Display & interaction | NV3030B LCD + CST816D touch + two buttons + buzzer | Local display and operation |
| Sensors | SC7A20HTR + AHT20 | Screen orientation, internal temperature/humidity |
| Power | SY8511BADC / TLV62084 / TPS2116 / TP4057 | Three-input switching, 3.3 V regulation, battery charging |
| Storage & update | 16 MB on-chip Flash + dual OTA partitions | Firmware, font resources, OTA update and rollback |
3.2 Power & Battery Management

- Three power inputs: the XT60 circuit under test, USB-C, and a single-cell Li-ion battery.
- XT60 input → SY8511BADC buck → 3.3 V (1 A max);
- USB / battery → TLV62084 buck → 3.3 V (2 A max);
- TPS2116 switches between USB and battery with USB priority — see the schematic for how the two rails are combined.
- TP4057 charges the Li-ion battery at 400 mA; the battery voltage is divided 1:1 into an ESP32 ADC for the battery gauge.
- The 3.3 V rail supplies the MCU, LCD, ADC digital side and sensors; analog front-end supply and filtering details are in the schematic.
Besides the TPS2116 solution for USB/battery priority switching (V2 board), there is also a discrete-MOS implementation (V1 board):

3.3 Voltage Sensing

The voltage channel uses a 101:1 precision divider (100 kΩ / 1 kΩ, ±0.1% thin-film resistors). The divided signal is buffered by a zero-drift op-amp (LRA8551A) and fed into ADS131M02 CH1 (PGA 1x). The divider is theoretically good to 121 V, but the auxiliary supply accepts at most 100 V, so the design measurement range is 0–90 V; one LSB is about 14.5 µV over that range.
3.4 Current Sensing
| Shunt on the bottom board | Current sensing schematic |
|---|---|
 |
 |
The current channel uses a 1 mΩ / 5 W four-terminal Kelvin shunt; the sense taps are independent of the high-current copper path to avoid copper resistance errors. After RC filtering the signal goes directly into ADS131M02 CH0 (PGA 16x). With PGA 16x the ADC full scale corresponds to ±75 A peak (1 LSB ≈ 8.94 µA).
The 5 W shunt limits continuous current to 70 A (70 A → 70 mV drop, 4.9 W dissipation); the XT60 connector is rated 30 A (30 A → 30 mV drop, 0.9 W). Builders who need higher continuous current can redesign the bottom board with an XT90 connector.
Why 1 mΩ? It covers ±75 A peak and 30 A rated while keeping shunt dissipation below 5 W. The trade-off is higher small-signal noise (σ ≈ 2 mA per frame), which the firmware handles with 200 ms block averaging plus a 2 mA deadband.
3.5 MCU, Display & Sensors

- The ESP32-S3 drives the NV3030B display over QSPI (4 data lines); the TE pin is reserved on the board but not used by the current firmware (refresh is driven by LVGL's partial flush).
- The CST816D capacitive touch controller uses I2C (0x15); its INT line is GPIO46.
- AHT20 (0x38) and SC7A20HTR (0x19) share the sensor I2C bus.
- Buttons K1 (BOOT) and K2 are active-low; the buzzer is low-side driven from GPIO1 through an AO3400A.
- The status LED on IO39 is active-low and indicates boot/fault states.
3.6 PCB Design
| Top board — top | Top board — bottom |
|---|---|
 |
 |
| Top board — detail | Bottom board |
|---|---|
 |
 |
Design notes:
- Two stacked boards connected by pin headers/sockets; the display and ICs live on the top board, while the high-current path stays on the bottom board.
- The current sense signal is a small differential signal: keep ISENSE traces short and away from DC-DC inductors and switching nodes.
- Keep the ADC SPI and DRDY traces short; avoid long parallel runs with clock or switching noise.
- Use wide traces on the high-current path to reduce drop and temperature rise at 30 A rated / 75 A peak.
- Ground and power handling for the analog front end and digital section are documented in the schematic and PCB project files.
The PCB project, Gerbers and interactive BOM are under
05-生产文件/; schematic PDFs are under01-Hardware/.
4. Software Design
4.1 Firmware Architecture
The firmware is based on ESP-IDF v6.1 + LVGL 9.6 and layered as driver / middleware / service / application:
main/                 boot flow, task creation, parameter wiring (app_tasks)
components/
├── drivers/          ads131m02 / lcd_nv3030b / key_button / buzzer / imu_sc7a20h ...
├── middleware/       data_store (snapshots) / web_console / wifi_manager / lvgl_port / fs_storage
└── services/         power_measure (measurement core) / ui / settings / orientation / system_state
Dual-core split (two Xtensa cores on ESP32-S3):
- Core 1 (measurement core):
task_sampleis driven by the DRDY interrupt — 4 kSPS frame reads, CRC checks, code-to-value conversion, waveform ring buffer, 200 ms block statistics and energy integration;task_auxhandles slow sensors such as temperature/humidity and battery. - Core 0 (interaction core): LVGL rendering, button events, WiFi/HTTP services and web pushes.
4.2 Measurement Pipeline
- ADS131M02 asserts DRDY every 250 µs; SPI DMA reads a 4-word frame (STATUS/CH0/CH1/CRC).
- After CRC-16/CCITT validation, calibrated coefficients convert codes to voltage V, current A and instantaneous power W.
- Raw samples are written into a three-tier PSRAM ring buffer for the waveform page.
- Every 200 ms (wall clock) the firmware settles block averages, average power, peak values and alarms, and integrates energy/capacity.
- Every 25 ms a 40 Hz display snapshot is produced in
data_store; both the UI and the web console only read snapshots.
Details and troubleshooting notes (stable 4 kHz reads, CRC spikes, memory strategy, software rotation) are in the architecture document.
4.3 Local UI
- A three-page
tileview: measure / waveform / settings; it stops at the first and last page. - Everything is operable with buttons only: K1/K2 single-click moves focus, double-click confirms, long-press opens/closes menus.
- The waveform page uses a fixed 5×10 grid; auto-ranging snaps to 1-2-5 standard grid values and axis labels drop trailing zeros (3 V / 0.2 A instead of 3.00 V / 0.200 A).
- Dialog width adapts to screen orientation (260 px landscape / 216 px portrait), so portrait mode is no longer clipped.
4.4 Web Console & API
- A single page embedded in the firmware (no external CDN); it works without Internet access.
- WebSocket
/wspushes snapshots at 15 Hz; on disconnect it falls back to 100 ms polling and reconnects every 5 s. - Five tabs: live data / waveform / settings / API / logs; settings are read back from the device on open.
- Main endpoints:
/api/state,/api/config(GET/POST),/api/info,/api/wifi/scan,/api/export.csv,/ws. - The API tab includes an inline "▶ Test" button that sends requests in place and shows status code, latency and response body.
4.5 Engineering
- Dual OTA partitions + rollback:
ota_update_start(url)performs a pull-style upgrade into the spare partition; a failed boot rolls back to the previous version. The web console does not expose a firmware-upload endpoint yet, so recovery still relies on USB/serial flashing. - coredump: crash dumps are written to a dedicated partition and can be exported for analysis after reboot.
- PC-side UI simulator:
tools/ui_simrenders the same UI sources on Windows and captures batch screenshots for layout regression before flashing. - Font subsetting:
tools/fonts/make_fonts.pyscans all UI strings and generates a GB2312 level-1 + level-2 font set.
5. Enclosure & Assembly
| Exploded assembly view | Printed parts | Accessories |
|---|---|---|
 |
 |
 |
| Middle frame detail | Board fit |
|---|---|
 |
 |
The enclosure is designed in SolidWorks; sources are in 04-外壳设计/, and 3MF print files are in 05-生产文件/03-外壳3D打印文件/. It is a three-part design: top cover, middle frame and bottom cover.
Assembly order:
- Insert heat-set inserts into the 8 screw holes on the middle frame (a soldering iron works well).
- Fit the bottom board into the bottom cover, place the middle frame on top (note its orientation in the photos), then tighten the four screws of the bottom cover.
- Wrap the battery in insulating paper, plug its lead into the battery connector on the top board, and stick the battery to the underside of the top board (the side with the ESP32 module) using double-sided tape.
- Place the top board with the battery onto the middle frame, taking care to align the pin headers.
- Fit the top cover.
- Finally attach the screen, fixing it with double-sided tape on its back.
6. Build & Reproduction
6.1 BOM & Cost
| File | Location |
|---|---|
| Full BOM | 05-生产文件/02-贴片/01-上板_V2-BOM.xlsx, 01-下板-BOM.xlsx |
| Interactive soldering assistant | 04-上板_V2-交互式BOM-焊接辅助.html (open in a browser; clicking a designator highlights it) |
| Designator maps | 03-上板_V2-位号图.pdf / 03-下板-位号图.pdf |
Cost estimate for the main components (prices fluctuate; for reference only):
| Item | Qty | Unit price (CNY) | Notes |
|---|---|---|---|
| ESP32-S3-WROOM-1-N16R8 | 1 | 31.6 | MCU & WiFi module |
| ADS131M02 | 1 | 16.8 | 24-bit ADC |
| 1.83-inch capacitive touch LCD, NV3030B | 1 | 14.8 | Ribbon cable included |
| 1 mΩ / 5 W four-terminal Kelvin shunt | 1 | 3.69 | Four-terminal |
| 500 mAh Li-ion battery | 1 | 8.2 | Single cell |
| PCB (top + bottom) | 2 | — | Free prototyping at JLCPCB |
| Enclosure (3D printed) | 1 set | 15 | Top / middle / bottom |
6.2 PCB Fabrication & Stencil
| Item | File |
|---|---|
| Top board Gerber | 05-生产文件/01-PCB/Gerber_上板_V2.1.zip |
| Bottom board Gerber | 05-生产文件/01-PCB/Gerber_下板_2026-09-22.zip |
| Stencil | 05-生产文件/01-PCB/手工焊接用钢网/上板V2钢网.GTS (both top and bottom apertures on one sheet; order a laser stencil from Taobao or a local service) |
Suggested board thickness is 1.2 mm; the default impedance/stackup process is fine.
6.3 Soldering
- Buy solder paste; align and fix the stencil on one side, then spread the paste.
- Place the SMD components after pasting.
- Reflow on a hot plate or with a hot-air gun.
- Solder the through-hole parts.
6.4 Flashing
Windows one-click flashing (requires ESP-IDF v6.1, or a pre-configured environment):
cd 02-Software/XT60-Power-Meter-Firmware
.\build_fw.bat          # build the firmware
.\flash_fw.bat COM3     # flash; use the COM port shown in Device Manager
You can also flash directly from the browser with ESPConnect, without installing ESP-IDF. See the build & flash guide for the image offset table, all three flashing methods and troubleshooting.
Do not flash the app image alone. The full firmware consists of five images, and the Chinese font lives in a separate
storagepartition — an OTA-only update results in "upgrade succeeded but Chinese still shows as boxes".
6.5 Calibration
- With no load, go to Settings → Measurement Settings → Current zero calibration; it samples for 3 seconds and zeroes automatically.
- Voltage calibration: apply a known reference voltage (e.g. 12.000 V) and correct gain/offset from the measured value.
- Current calibration: connect a reference meter or electronic load in series and correct accordingly.
- Calibration values are stored in NVS and survive power cycles and firmware upgrades.
7. Usage

- Wiring: connect the power source/battery to the XT60 input and the load to the output; observe polarity. Input and output may be reversed; negative current is displayed. Rated ±30 A, short-term peak ±75 A (the rating is limited by the XT60 connector; for sustained high current, replace the bottom board with an XT90 version).
- Power on: switch to USB/battery to boot. If the switch is in XT60 mode, applying 5 V or more also boots the device. The splash screen shows real initialization progress (including hardware self-tests); splash text uses a small font subset embedded in the firmware, so Chinese is complete on the very first frame, while the full main-UI font keeps loading in the background.
- Measurement: the main page shows voltage, current, power and energy; tap the bottom energy row to toggle between Wh and Ah.
- Waveform: swipe to the waveform page; swipe up to open the quick menu and switch time windows and V/I/P modes.
- Quick menu: swipe up on the measurement page (or long-press K2) to change the data refresh rate or clear energy statistics.
- Network setup: Settings → WiFi & Hotspot → scan for WiFi and enter the password (or use hotspot mode: connect a phone/PC to the device hotspot and open the web console to provision). A WiFi icon appears in the status bar once connected.
- Web console: open the device IP in a browser; five tabs: live data, waveform, settings, API, logs.
- Charging: connect 5 V to USB-C; TP4057 charges at 400 mA and the status bar shows the battery level.
| Measurement in use | Waveform running | Settings | Quick menu |
|---|---|---|---|
 |
 |
 |
 |
A current reading of 0 with no load is normal: when |I| < 2 mA the firmware reports 0 (small-signal deadband) to eliminate last-digit jitter caused by the 1 mΩ shunt noise. The waveform page still shows raw samples, so mA-level changes remain visible.
The meter itself draws about 0.7 W:

8. Roadmap
- OTA upgrade feature (web upload entry point).
- USB serial host communication plus companion PC software.
- ...
These are planned when time permits; PRs are welcome.
9. Known Issues
① Back-feeding from battery/USB into the XT60 connector. When powered from battery/USB, the 3.3 V rail back-feeds into the XT60 connector through the body diode of the XT60 buck converter's internal MOSFET and the body diode of the power-control MOSFET (Q4). As a result, about 2.45 V appears on the XT60 connector even with no input connected (3.3 V minus the MOSFET body-diode drop).

Possible fixes:
- Add another MOSFET in series after Q4, oriented back-to-back.
- If you do not need XT60-powered operation and do not want to change the circuit, simply do not populate the XT60 buck section and run on battery only.
- If you do not need battery/USB power, just switch to XT60 power mode.
10. Repository Structure
XT60-Power-Meter/
├── 01-Hardware/              Hardware design
│   ├── 01-XT60功率计-立创EDA工程.epro2
│   ├── 02-上板原理图_V1.pdf / V2.pdf
│   └── 02-下板原理图.pdf
├── 02-Software/
│   └── XT60-Power-Meter-Firmware/    ESP-IDF firmware project
│       ├── components/               drivers / middleware / services
│       ├── docs/                     architecture, flashing, pinout
│       └── tools/                    font tools, LVGL UI simulator
├── 03-Datasheet/             Datasheets for all components (CN/EN)
├── 04-外壳设计/              SolidWorks sources (top/middle/bottom, assembly)
├── 05-生产文件/
│   ├── 01-PCB/               Gerbers, stencils
│   ├── 02-贴片/              BOM, designator maps, interactive soldering aid
│   └── 03-外壳3D打印文件/    3MF files
├── images/                   README images
├── LICENSE                   Hardware license (CERN OHL-S v2)
└── README.md
11. Documentation Index
- Firmware README — firmware features, hardware summary, build and flashing
- Build & Flash Guide — five images, three flashing methods, decision table and troubleshooting
- Architecture — layering, dual-core split, measurement pipeline, lessons learned
- Pinout — all GPIOs and peripheral mappings
- Contributing Guide — commit conventions, code style, comment requirements
- Third-Party Licenses — licenses for LVGL / esp_lvgl_port / fonts, etc.
12. Contributing
- Fork this repository and create a
feat/xxxorfix/xxxbranch. - Commit messages follow Conventional Commits.
- For firmware changes, run the
tools/ui_simscenario regression first, then verify on real hardware. - Open a Pull Request describing the motivation, how it was verified, and the impact.
For hardware changes (schematic/PCB/enclosure), include a change description and photos. When reporting measurement anomalies, please provide serial logs and the /api/info version information.
13. License
- Hardware design (schematics, PCB, enclosure, production files) — CERN OHL-S v2, a strongly reciprocal open-hardware license; derivative hardware must be published under the same license.
- Firmware source (
02-Software/) — MIT. - Third-party components (LVGL, esp_lvgl_port, Noto Sans SC, etc.) — retain their own licenses, see THIRD_PARTY.md.
14. Disclaimer
- Measurement results from this device are not valid for metrological certification.
- 90 V / ±75 A peak (±30 A rated) involves hazardous voltages and currents. When wiring, soldering and testing, guard against short circuits, electric shock and reverse polarity. Use suitable wire gauge and connectors for high-current tests.
- The author assumes no liability for any direct or indirect loss caused by the use of this hardware or firmware.
- Issues and improvement suggestions are welcome via GitHub Issues or Gitee Issues.
Open-Source Project Recommendations
- An open-source three-phase energy meter for monitoring home electricity usage: https://blog.zeruns.top/archives/43.html
- Open-source smart electronic load based on CH32V307 (embedded competition project): https://blog.zeruns.top/archives/39.html
- SC8703-based adjustable buck-boost DC/DC power supply, voltage & current adjustable, PD fast-charge input supported: https://blog.zeruns.top/archives/84.html
- 24V3A flyback switching power supply based on UC3842, with transformer parameter calculation: https://blog.zeruns.top/archives/74.html
- Open-source USB-C docking station: 4× 10Gbps USB-A ports + 2.5G Ethernet + card reader: https://blog.zeruns.top/archives/53.html
- STM32-based synchronous rectification buck-boost digital power supply (open-source): https://blog.zeruns.com/archives/791.html
- Open-source 140W+65W buck-boost PD3.1 charger module (2C+1A ports), IP6557+IP6538, 205W desktop charger: https://blog.zeruns.com/archives/801.html
Recommended Reading
- Cost-effective and cheap VPS / cloud server recommendations: https://blog.zeruns.com/archives/383.html
- Build your own Minecraft 26.2 server: a step-by-step Java Edition hosting guide for beginners: https://blog.zeruns.top/archives/97.html
- Tutorial: building cross-border e-commerce independent sites, WordPress foreign trade site guide: https://blog.zeruns.top/archives/64.html
- Hermes Agent deployment guide: build your first AI assistant step by step: https://blog.zeruns.top/archives/90.html
- Ugreen DXP4800Pro NAS unboxing, review and teardown: https://blog.zeruns.top/archives/95.html
- Discourse forum setup tutorial: zero-base deployment of an open-source community forum: https://blog.zeruns.top/archives/79.html
XT60 Power Meter — hardware CERN OHL-S v2, firmware MIT. Not a certified metering instrument; be careful with high voltage and high current.
Comment